Traffic Monitor Kota Bogor
Traffic Monitor Kota Bogor
― Traffic diagnosis from connected public CCTV feeds
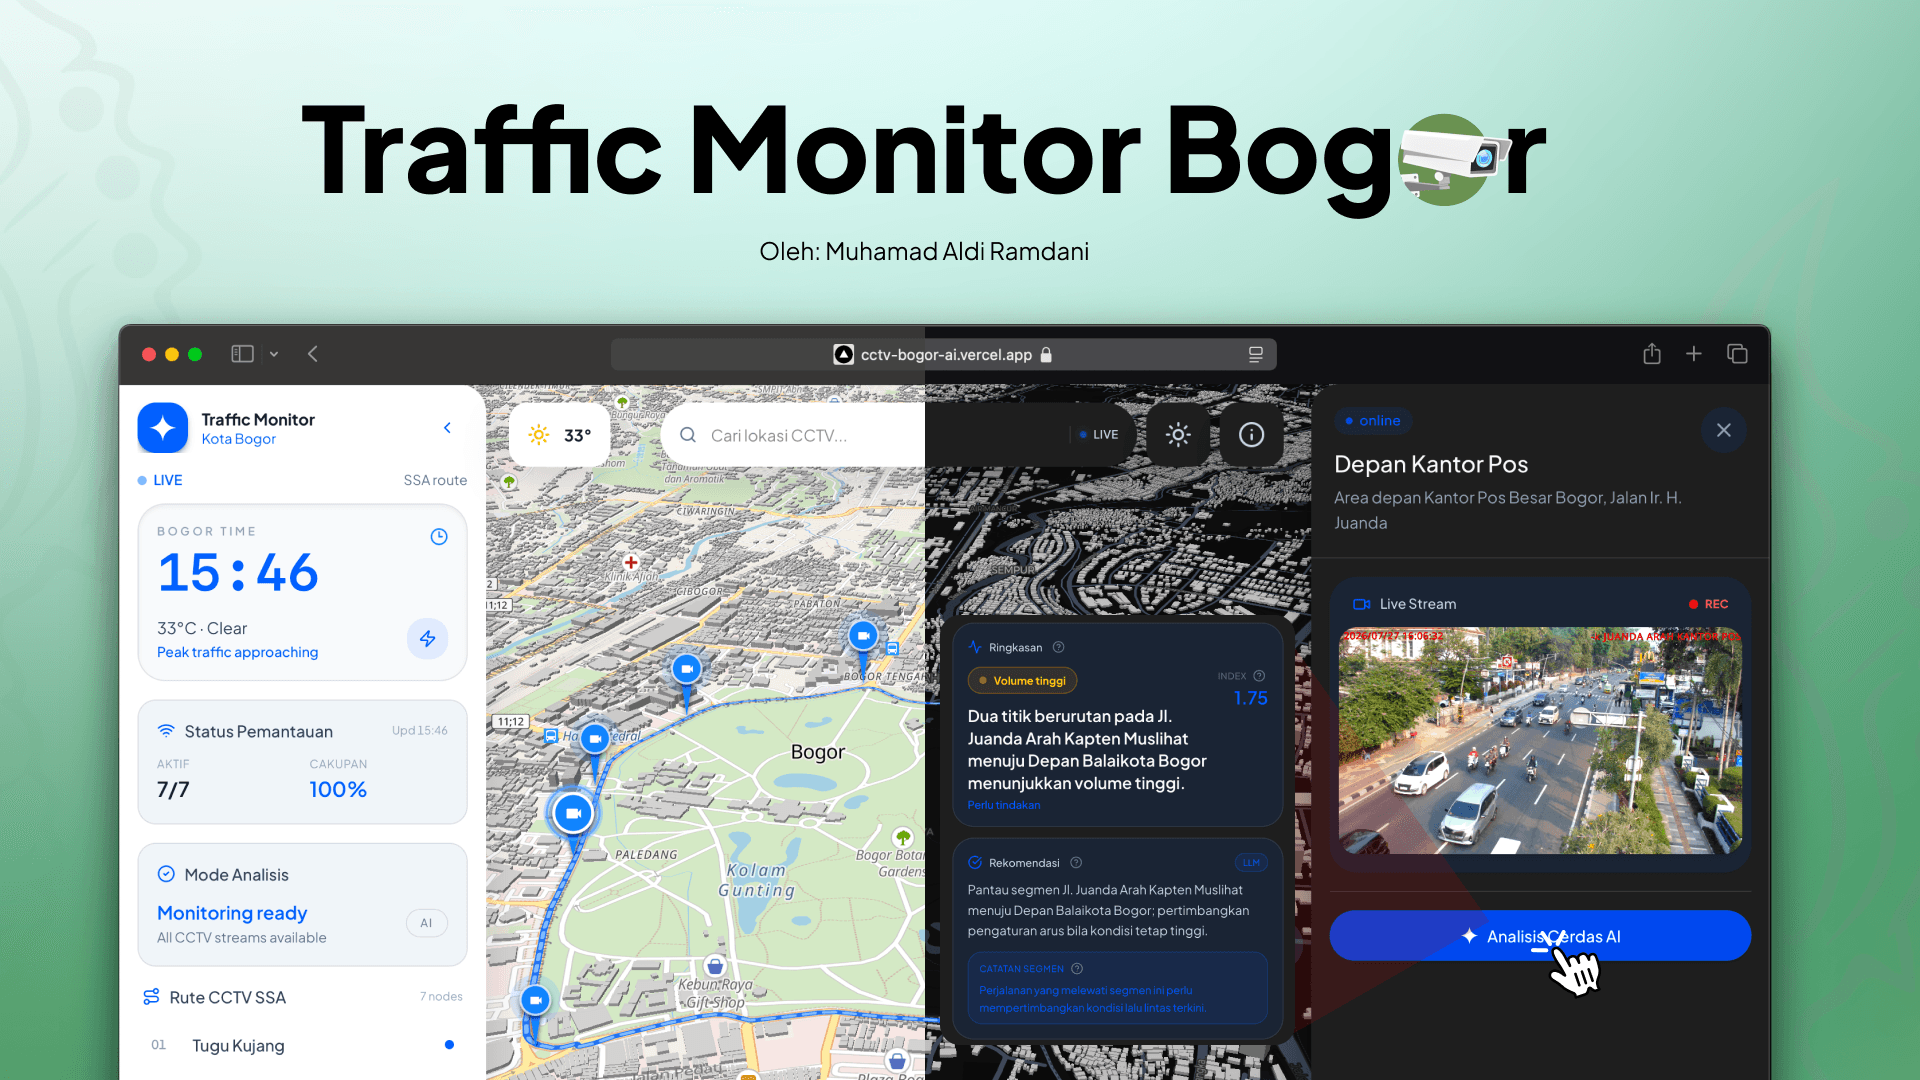
Bogor Single Window exposes traffic CCTV feeds one camera at a time. A viewer can see a queue, but one feed cannot show whether the obstruction sits at that point or farther along the one-way corridor. I built Traffic Monitor to compare connected cameras and show the counts and camera pair behind each diagnosis.
| Field | Record |
|---|---|
| Role | UX researcher and full-stack developer |
| Period | 2025 to 2026 |
| Context | Information Systems undergraduate thesis |
| Dataset | 112 images and 2,010 vehicle annotations |
| Evaluation | 18 diagnostic scenarios and 30 latency requests |
Problem
Traffic moves around the Bogor Botanical Gardens through a sequence of connected roads. A queue at one camera can start at the next point. Operators need both locations before they can separate a local bottleneck from corridor-wide volume.
The existing feeds also vary in angle, visible road area, light, and stream health. A raw count from one camera cannot serve as a fair comparison with another camera. I needed a camera-specific baseline and a direction-aware comparison.
Role and scope
I collected CCTV frames, annotated vehicles, trained the detector, designed the database, and built the backend and frontend. I also wrote the diagnostic rules and ran model, functional, and latency tests.
The prototype provides on-demand information. It does not control signals, issue enforcement decisions, or calculate routes.
Process and decisions
I collected frames from seven cameras across day, night, light traffic, and heavy traffic. In Roboflow, I marked motorcycles, cars, and large vehicles with bounding boxes. The final dataset contains 1,189 car annotations, 749 motorcycle annotations, and 72 large-vehicle annotations.
Vertex AI returns each vehicle class, box, and confidence score. FastAPI removes detections below 0.5 confidence, then counts the remaining vehicles. I set two thresholds for each camera because perspective and visible road area differ by location.
density index = vehicle count / camera lower threshold
I stored the cameras in traffic-flow order. FastAPI captures the selected point and its downstream neighbor, runs both requests at the same time, and compares their status. The rules classify a local bottleneck, volume saturation, or a normal pattern. Gemini receives the completed diagnosis and writes the summary. The model does not decide the traffic condition.
Redis stores stream health and cached requests. PostgreSQL stores camera records and analysis history. This separation helped me trace stream, inference, rule, and response failures.
Test results
| Measure | Result |
|---|---|
| mAP | 0.657 |
| Precision | 87.2% |
| Recall | 74.0% |
| Correct topology-aware diagnoses | 16 of 18 scenarios |
| Mean request latency | 5.29 seconds across 30 requests |
| Functional tests | 10 of 10 passed |
The detector reached 0.657 mAP, 87.2% precision, and 74.0% recall. The traffic rules classified 16 of 18 scenarios correctly, while 30 requests averaged 5.29 seconds. All 10 functional tests passed. The interface shows both counts, the critical pair, congestion status, and the generated recommendation beside each label.
Limits
The dataset covers 112 images and seven camera points. The large-vehicle class has 72 annotations, which gives the detector fewer training examples for that class. The system also lacks regions of interest, historical baselines, and tests across longer camera chains.
Vertex AI charges for an active endpoint. I chose on-demand inference to control that cost, which creates a wait of several seconds. A city-scale release would need more data, monitored thresholds, regions of interest, and tests under higher request volume.